
PrometheuxPrometheuxisisananAI-poweredAI-poweredknowledgeknowledgeplatformplatformthatthathelpshelpsorganizationsorganizationsstructure,structure,visualize,visualize,andandunderstandunderstandcomplexcomplexdata.data.
About Project
Prometheux powers explainable reasoning over the world's largest Knowledge Graphs - From drug discovery to banking companies like Revolut.
Made scientists come from the Knowledge Graph labs across the University of Oxford and TU Wien.
Modern organizations are built on data — but most of that data lives in silos. It’s stored across spreadsheets, databases, and APIs that don’t “talk” to each other. Prometheux set out to change that by creating a knowledge platform that connects data through meaning, not just storage.
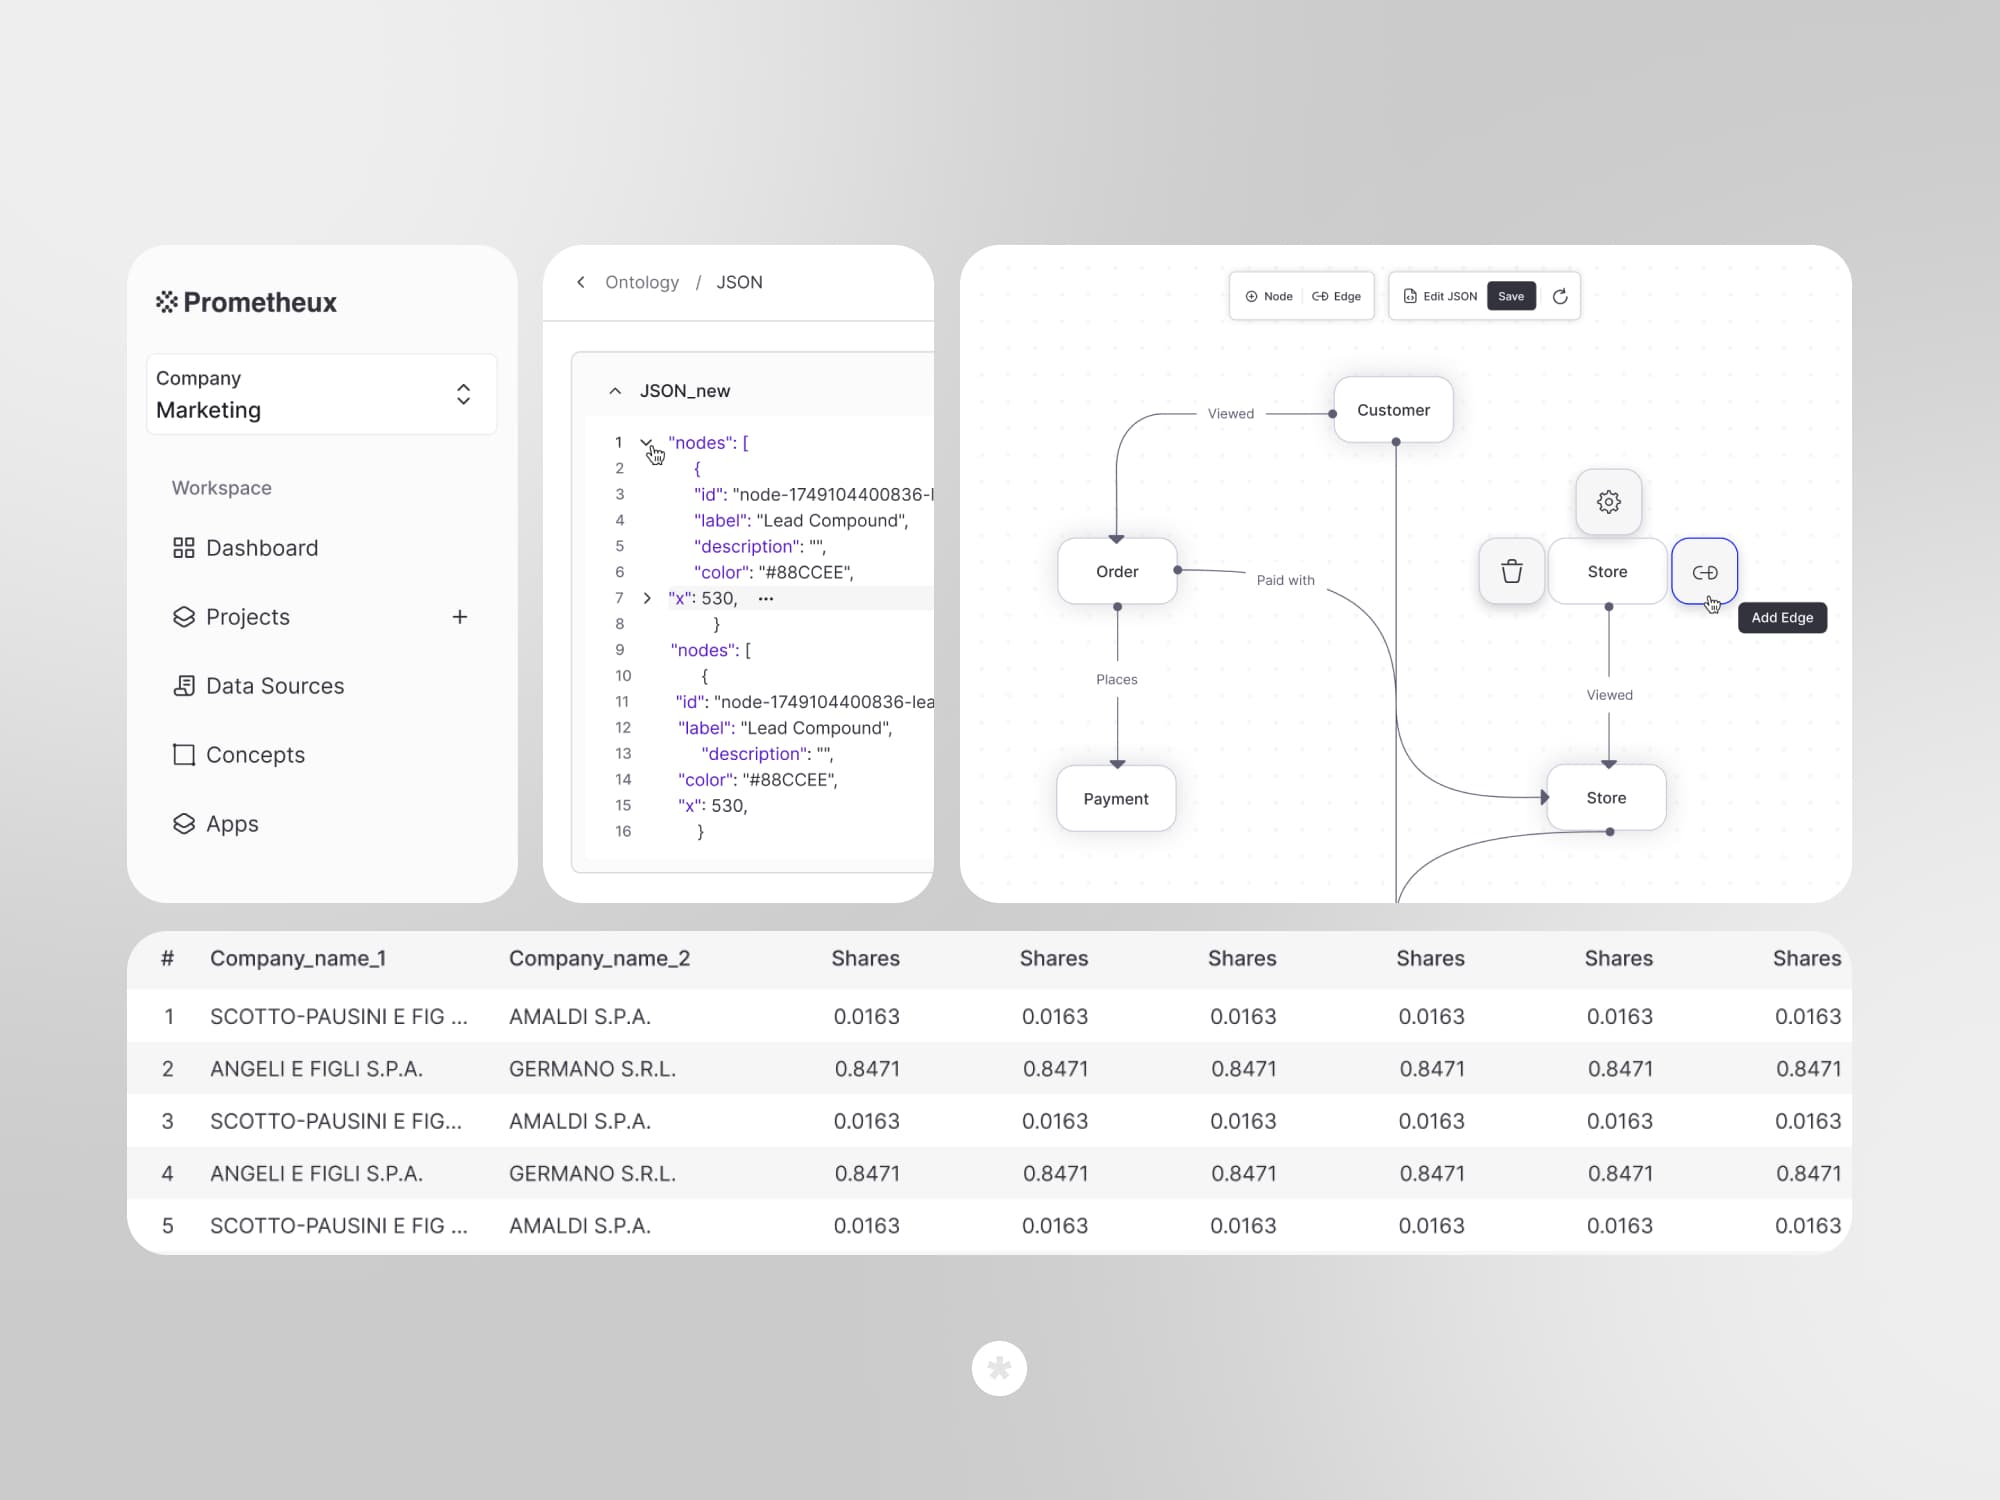
The platform uses ontology-based modeling to define relationships between entities — transforming raw data into a structured, living network of knowledge. Overcode joined the team to design and develop the core product experience — the Ontology Builder — the visual brain of Prometheux.

Requirements
Enterprises have no shortage of data. What they lack is context.
Without a unified system of relationships, data scientists and business teams waste hours reconciling models, cleaning duplicates, and guessing how one table connects to another.
Prometheux want to building a product where users could design data relationships as easily as drawing a flowchart — and make those relationships drive intelligent insights across the platform.
Our challenge was to turn a deeply technical concept, ontology, into an elegant, approachable interface that anyone could use without losing analytical power.

Solution
You may also like
See examples of real products we’ve built and the impact they’ve made for our clients.

Upriver - Data Quality Management app
Web development | React.js, Next.js, SWR

DataFlint - AI copilot for Apache Spark
UX/UI Design and Web development | React.js, Next.js

SignifAI (Acquired by New Relic)
Web development | React.js, Redux, AWS

Hydrolix - Cloud SaaS Data platform
Web App design & development | React.js, Next.js, Python, AWS