Data Visualization Services
Data visualization service company
100+
Web & Mobile projects successfully completed in various niches
5.0
Average rating on Clutch, based on verified client reviews
$1B+
Funds raised by our partners & clients
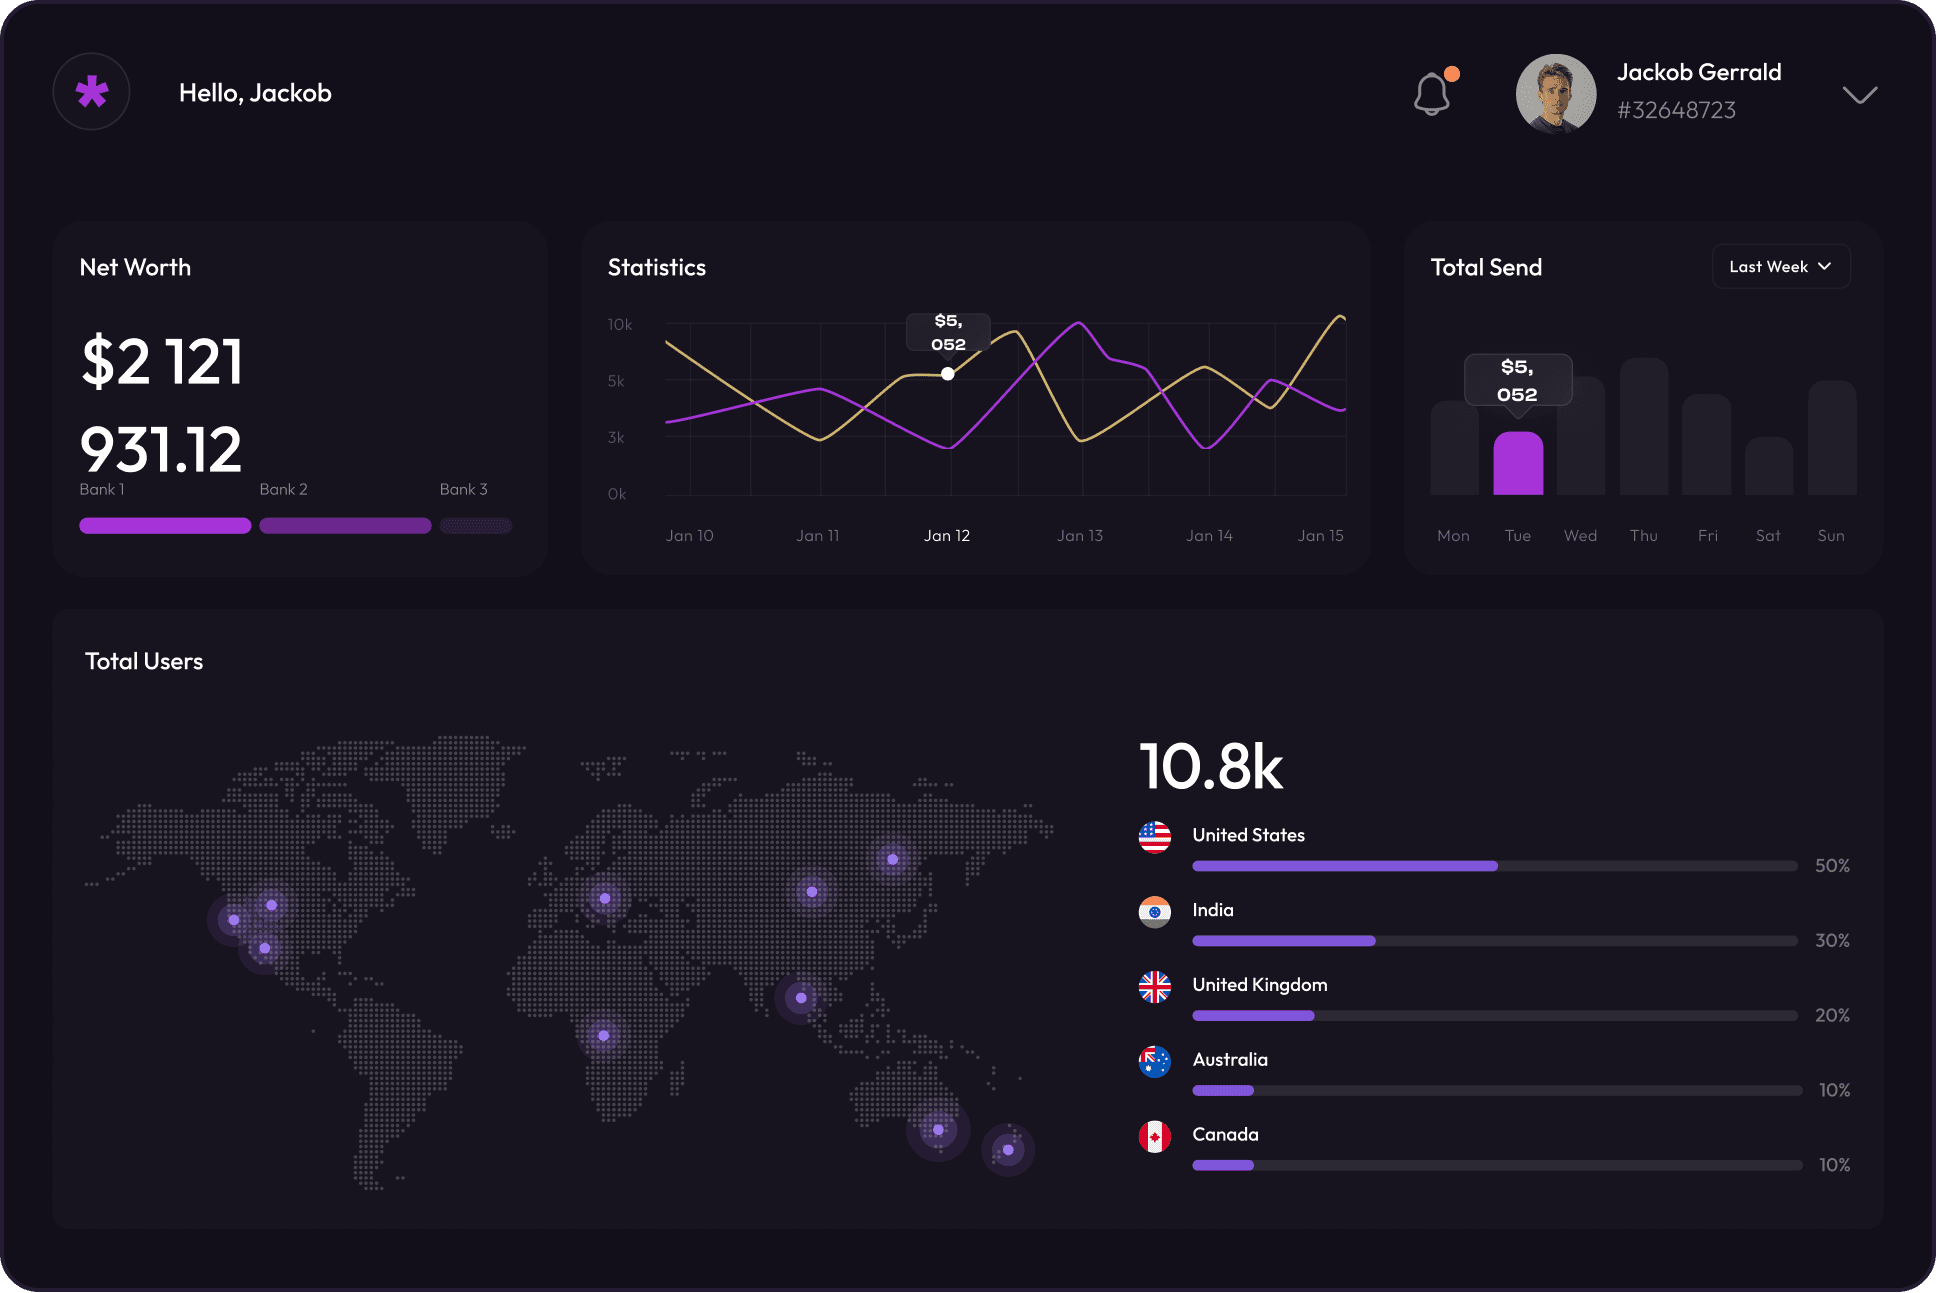
Visualization Software Built Around Your Data, Workflows, and Decisions
Data visualization software turns datasets into interactive visuals that teams in almost any industry can understand and act on instantly.
Off-the-shelf tools often miss the mark, while custom data products are built around personal experience, workflows, and metrics, from patient monitoring to platform analytics, innovative warehouse ops, or real-time supply chain dashboards.
Overcode helps clients build modern visuals that surface what matters, making customer, product, or domain-specific data ready for high-quality, confident decisions.

Digital Data Visualization Services for Fast, Focused Decisions
This is what you get when data visualization is done right, with Overcode behind the build.

Visualize Insights
Get interactive dashboards built around your business logic, without hiring in-house analysts or devs. Overcode turns scattered metrics into focused, readable views that support better decisions through effective data visualization customized to your product, users, or internal operations.

Real-Time Clarity
Live dashboards show what’s happening across product, sales, operations, or finance without delay. We connect directly to your systems, clean the data, and build real-time views, so there’s no need to maintain infrastructure or track changes across disconnected tools.

Navigate Together
Visual tools support day-to-day decisions, keep teams aligned, and reduce the need for constant check-ins. Clear context speeds up coordination across roles and departments, and it’s Overcode handling the tech tasks, not someone you still need to hire or train.

Master Big Data
Large datasets are hard to read and even harder to act on. We design scalable visualizations that surface what matters, from user behavior to platform load. Overcode handles the complexity, so insights are clear and usable across product, business, or executive teams.
Different Types of Data Visualization
Add motion, flexibility, and context to how data is presented with interactive data visualization.


Looking for the best way to start?
Get a Data Visualization Project Estimate
Share a few details about your data visualization product and we’ll help you understand the likely scope, timeline, technical approach, and next steps.
Get clarity
on scope, timeline, and integrations.
Data Visualization across Industries
Every industry has its own rules. We specializa in data visualization as a service solutions that fit real workflows, goals, and users.
Healthcare
Telemedicine, Medical Devices, Mental Health, BioTech, AgeTech, IVF, EHR / EMR
Data Platforms
Data Quality tools, Alerting & Incidents automation, Observability / Monitoring apps
Travel & Hospitality
Flight / Hotel / Experience Booking apps, Travel Planning, HMS, Event & Festival apps
Web3 & Blockchain
Electric vehicles
Fintech
FoodTech
Real Estate
LawTech & LegalTech
How We Cooperate
Whether you need full-cycle software development or dedicated experts — we design, develop, and build integrations for web and mobile apps.

Acquaintance
We’re getting to know each other, learning your requirements and expectations

Work Planning
We make reliable time and cost estimates for you and set up the best workflow for the project needs

Discovery phase
We study the problem that the app will solve and come up with solutions for software implementation

UI/UX Design
We design an actual product based on the approved User Flows and Wireframes

Development
We assign and manage dedicated development team on our end that works on your app or website

Support
We provide ongoing support and develop new features when needed after the product launch
Introduction
We’re getting to know each other, learning your requirements and expectations

Cooperation start
We agree on the project start date and sign the contract

Providing CVs
We present you the most relevant specialists with their CVs, and you choose who you want to talk with

Interviews
We set up video calls between you and all the potentially matching candidates

Approval
After the interviews, you share feedback with us and approve the specialists who start the onboarding shortly

Scaling
Anytime you need to speed up the process, we’re ready to expand your team with new specialists
Full-cycle software development services
Are you looking for mobile & web app development partner? Explore the different models of the outsource data visualization services we offer.


Data visualization projects case studies
See examples of custom data visualization projects we’ve built and the impact they’ve made for our clients.

Prometheux - data foundation layer for AI
UX/UI Design

DataFlint - AI copilot for Apache Spark
UX/UI Design and Web development | React.js, Next.js

Embryonics - AI IVF Company
Web App design & development | React.js, Redux, AWS

Data Visualization Software (NDA)
UX/UI Design and Web development | React.js, Node.js

Ground Control Coffee - IoT Company
Web App design & development | React.js, Next.js, AWS, Firebase

Threshold - Generational Care app
Mobile App design & development | React Native, Node.js
Technologies we use
Explore the tools and technologies we use to design and develop data visualization dashboards across every layer of the stack.
Data Visualization Platforms
Solutions that transform raw data into interactive dashboards and visual insights.


Visualization Libraries
Flexible tools for building all types of custom interactive charts.


Front-end
Frameworks and libraries we use to build performant and responsive user interfaces.


Back-end
Services and tools that power the core logic, APIs, and third-party integrations behind the scenes.


Infrastructure
Tools for deploying and monitoring apps in production — with CI/CD support and cloud-native scalability.


Database
Storage technologies we trust to manage structured and unstructured data at any scale.


AWARDS & RECOGNITION


What our clients say


Hire our expert data visualization developers
Meet the team behind our projects — expert data visualization developers, designers, and managers who don’t just deliver code, but integrate deeply into your process and goals.

Vlad S.
Team Lead

Artem L.
Full-stack Developer

Mykyta P.
Front-end Developer
FREQUENTLY ASKED QUESTIONS
Answers to the most common questions about our data visualization services, cooperation models, and what it’s like to work with Overcode.
How can data visualization and dashboards help my business?
Data visualization and dashboards turn complex data into understandable charts and graphs. This is necessary for a quick glance at what is happening in the business. You receive a real-time visual representation of key metrics, from sales to user behavior. This approach opens up new opportunities: more accurate decisions and early-stage identification of future issues. Simply put, you don’t just see the data, you also begin to understand and use it.
Can you help identify key metrics or data points to visualize?
Yes, we can help you identify the key metrics and data points during the Discovery phase. This is the initial stage of cooperation where we will dive into your workflows, review other solutions on the market, and propose our ideas tailored to your product.
We will propose the types of data and their representation that will have the most impact on your business and decision-making process.
What data sources (Databases, APIs, etc) can you connect with (e.g., SQL, Google Sheets, AWS)?
We integrate with almost any data source available:
- Cloud platforms and databases: AWS, GCP, Azure, Firebase, Supabase, etc.
- SQL and No-SQL databases: PostgreSQL, MySQL, MongoDB, etc.
- Any REST or GraphQL API
- CRM, ERP, or any other system where you store the data.
Will the solution support real-time data visualization?
It depends on your project requirements and the data sources you use.
We have experience implementing real-time data in dashboards using WebSockets or long polling, especially for high-frequency use cases like trading tools, where low latency is critical.
Can you add advanced analytics features, such as predictive AI insights?
Yes, we regularly integrate third-party services and APIs into our customers' products.
We can integrate anything — from payment systems (like Stripe) and CRM, to cloud storage providers and AI LLMs. We have experience in AI integration to process data sets and generate insights based on them, so you will see an immediate impact of the data visualizations we create.
We will also ensure the safe and stable operation of all integrations before the release.
Are there licensing restrictions for third-party libraries or tools used?
It depends on the specific tool or library; some may come with licensing requirements. We carefully evaluate each dependency and align with the client before using anything that may incur future costs.
Our goal is always to strike a balance between the development time a solution can save and its long-term value for your project.
Can you provide training for my team to use and manage the solution?
Yes, we can create technical documentation for the project and also offer online training for your staff to make sure the software is used effectively. After release, we will not disappear and can provide long-term support for your application.
Will you help troubleshoot issues if the visualization stops working or displays errors?
After the release, we will stay with you - we see great value in long-term cooperation. That's why our clients refer us repeatedly and recommend us to their professional network. We make sure everything is stable, fix bugs quickly, and add new features as your product grows.
We offer different formats of support, such as one-time enhancements or ongoing support on a subscription basis.
How do you handle non-disclosure agreements (NDAs) and confidentiality? Who will own the intellectual property (IP) for the visualizations?
We are responsible for protecting the confidential data of our partners.
We sign a legal agreement with each client, according to which all rights to the source code and intellectual property belong to the client. Each project we develop is unique. We do not reuse the same code in different projects, and we do not disclose our customers' private information.
We are also ready to discuss any additional data protection measures tailored to your requirements and the project's specific needs.
HAVE A GREAT IDEA? LET’S TALK ABOUT IT
Data visualization articles
Insights from our experts on building custom data visualization solutions.
How to choose a software development company
Your project’s success depends on the right partner. Discover 10 proven strategies to find the perfect software development company for your product.
What are the steps of the development process for a software project?
Discover the essential phases of software development, from initial analysis to final deployment, and learn how to navigate each effectively.
How much does it cost to build an app today
From MVPs to full-scale apps, discover what influences development costs and how to plan your budget wisely with our comprehensive guide.